Digital Twin Creation
A “digital twin” is a virtual replica of a system that represents the 3D layout of a scene such as an industrial facility, including the identity of components. It can be used for training, simulation, and analysis of industrial facilities. At Diamond Age Technology, I helped develop an automated process to create a digital twin from scan data. This was supported by funding from NSF under SBIR grants.
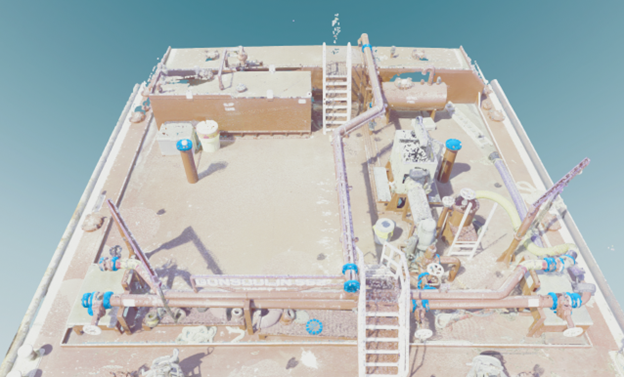
The video below shows a colored point cloud of a portion of an oil-carrying barge, captured using a Leica RTX360 scanner. The entire barge scan consisted of about 400M points.
Point cloud of the pump deck portion of an oil-carrying barge.
Semantic Segmentation
I trained a semantic segmentation neural net model to classify each point as one of 28 semantic classes. The neural net model was a custom “U-Net” architecture, that I developed using PyTorch. The input to the network consisted of synthetically rendered images of the point cloud. The viewpoints for the synthetically rendered images were chosen automatically. The rendered images consisted of two channels: grayscale and depth.
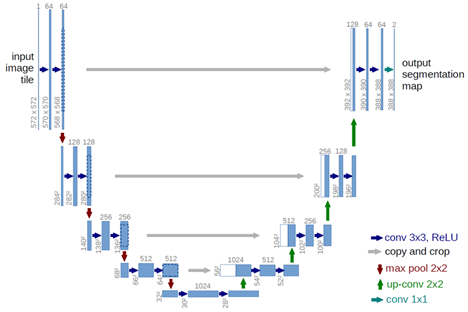
U-Net architecture for semantic segmentation of the point cloud.
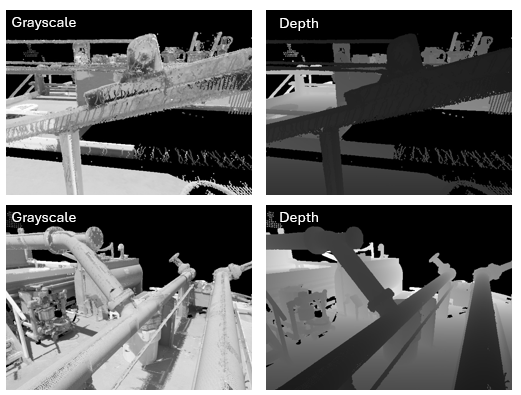
Example synthetic rendered images of the point cloud.
To obtain a single class label for each 3D point, the results from all images must be combined. To do this, I used the “deep features” from the neural net, which are the features from the layer just before the classification layer. I projected the deep features from each image pixel to 3D points and averaged all the deep features at each 3D point. The averaged deep features were then run through the classification layer to find a final class label and probability for each 3D point.
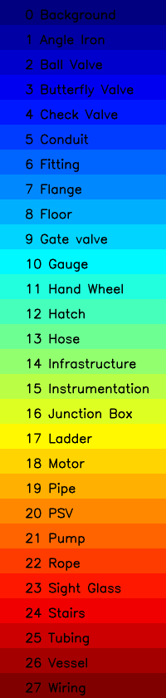
The legend in the figure shows pseudo colors for each of the 28 semantic classes. The classes were chosen by a subject matter expert.
Semantic segmentation of the points from the barge scan.
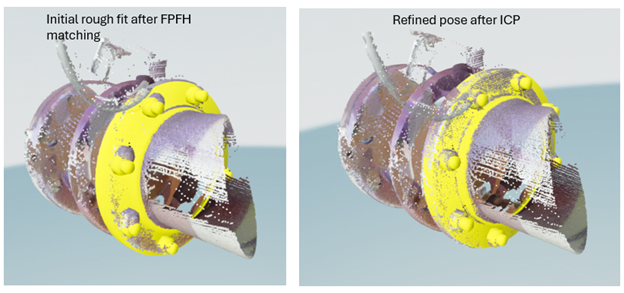
We next identified individual components in the labeled point cloud. I clustered points of a single class, such as a “flange”. I then fit known 3D mesh models to the points. This was done using a conventional process of using RANSAC to match a sparse set of feature points to find a rough pose and then using ICP to refine the pose. The best-fitting model to the data was taken to be the correct component in that location. An example of fitting a flange model is shown below.
Object Detection
The result of flange detection on the barge point cloud is shown below. There were 79 detections, of 13 different flange types. A final interactive process was used to eliminate false detections and add any missing detections.